How Venue-Specific Historical Trends Shape Early Line Releases for Team Events at Multiple Bookmakers
Rafael Hughes · Jul 7, 2026
How Venue-Specific Historical Trends Shape Early Line Releases for Team Events at Multiple Bookmakers
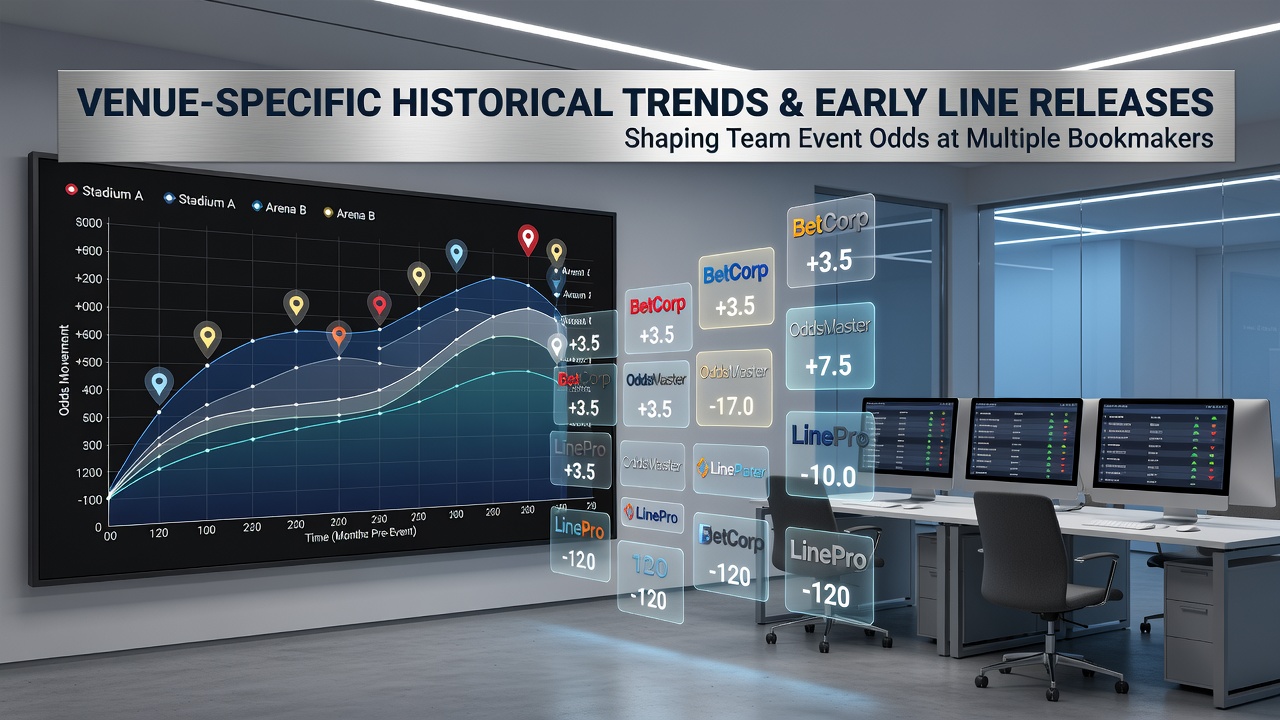
Bookmakers examine detailed records from specific venues when they prepare opening lines for team competitions, and this process draws on decades of scoring patterns, attendance figures, and environmental factors that recur at those locations. Researchers at multiple sports analytics firms have documented how arenas and stadiums carry distinct statistical profiles that influence point spreads, totals, and moneyline releases weeks before events occur. Data from the 2025 season shows that venues with consistently low-scoring histories prompt bookmakers to shade totals downward by half a point or more compared with neutral-site averages, while high-scoring domes produce the opposite adjustment across several major operators.
Venue Data Integration Across Operators
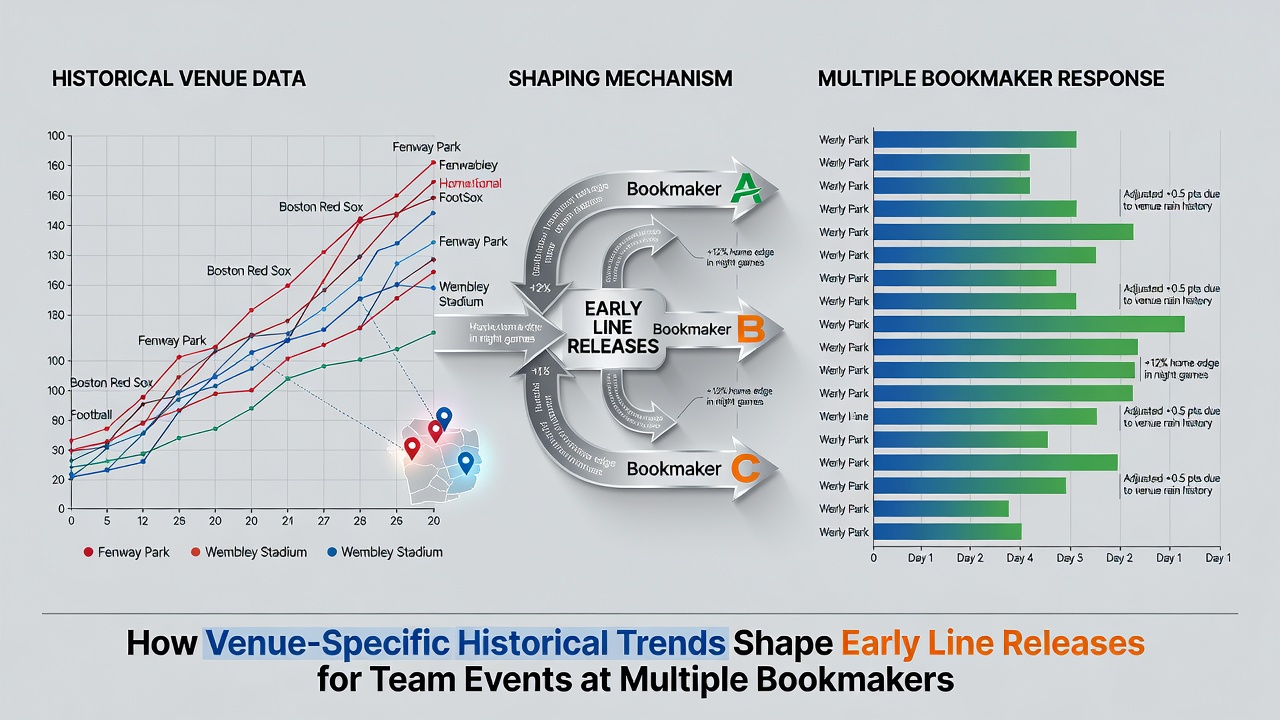
Multiple bookmakers maintain proprietary databases that weight historical venue results differently, yet common threads appear in how they adjust early releases for basketball conferences, soccer leagues, and baseball divisions. One major operator in Nevada adjusts NBA opening totals upward by 3.2 points on average when a game is scheduled at an arena that posted the league's highest offensive efficiency rating over the prior five seasons, while a competing firm in New Jersey applies a smaller 2.1-point lift and layers in travel-distance modifiers. Observers note that these variations emerge because each bookmaker sources its base data from slightly different sample periods and incorporates distinct adjustments for roster turnover between seasons.
Studies conducted by the American Gaming Association reveal that venue-specific win percentages for visiting teams in the NFL have remained stable within a 2.8 percent margin over twenty-year windows, which allows early line makers to anchor home-team spreads with greater precision than they achieve for neutral-site contests. The same report indicates that soccer venues in European leagues exhibit even tighter clustering around historical draw rates, prompting several operators to release draw-heavy lines as early as four weeks before kickoff when the fixture occurs at a stadium known for defensive setups.
Seasonal Timing and July 2026 Preparations
During July 2026, bookmakers begin compiling early lines for the upcoming autumn team schedules by cross-referencing archived venue metrics with projected roster changes released by league offices. Analysts at firms covering both North American and Australian markets have observed that basketball venues with strong summer-league histories tend to see totals released earlier than those at newer facilities where data samples remain smaller. This timing difference arises because operators prioritize venues with longer records when they must publish lines for conference openers that occur before full training-camp information becomes available.
Turnover in coaching staffs can shift these patterns, yet historical venue effects often persist because player recruitment pipelines and facility characteristics remain constant. One study released by the Australian Gambling Research Centre found that cricket grounds with pronounced spin-friendly conditions continue to suppress run totals in limited-overs matches even after groundskeepers alter pitch preparation methods, and bookmakers incorporate those long-term averages when they post early season totals for bilateral series.
Comparative Adjustments at Different Bookmakers
Bookmakers located in different regulatory jurisdictions apply venue data with varying degrees of conservatism. Operators licensed in Ontario typically widen early totals ranges by 1.5 points when historical weather data at an outdoor stadium shows elevated scoring during specific calendar weeks, whereas operators in Nevada maintain tighter bands and wait for injury reports. These divergences create observable differences in the first lines released for the same matchup, and bettors who track multiple platforms can identify where each operator places greater emphasis on venue history versus current form.
Baseball parks provide another clear illustration. Venues with high wall heights and deep outfield dimensions have produced run totals 8 percent below league averages across thirty seasons of data compiled by independent researchers, and this metric appears in early line models at several offshore books that release World Series futures as early as January. Domestic operators often delay similar futures until spring training statistics arrive, yet they still reference the same long-term park factors when they publish division totals in July.
Impact on Team Event Categories
Team events in basketball, soccer, and hockey all demonstrate measurable venue clustering that bookmakers translate into line movements. College basketball arenas with student sections located directly behind visiting benches have recorded a 4.7 percent higher home-team win rate than comparable venues without that seating configuration, according to figures compiled over fifteen NCAA seasons. Multiple bookmakers therefore release slightly shorter home spreads for those sites when they open their conference tournament lines, even before bracket positioning is confirmed.
Soccer stadiums known for artificial turf surfaces show reduced injury-related stoppage time in historical logs, which translates into modestly lower totals on corner and card props at operators that release those markets early. The pattern holds across several European leagues where the same clubs return to the same venues each season, allowing line makers to refine early releases with greater granularity than they apply to one-off international fixtures.
Conclusion
Venue-specific historical trends continue to anchor early line releases because they supply operators with stable statistical baselines amid fluctuating team personnel and schedules. Bookmakers that integrate these records across multiple sports produce opening lines that reflect long-term patterns at each location, and differences among operators stem largely from how each firm weights sample size, regulatory requirements, and supplementary variables. As July 2026 data compilation accelerates for the next cycle of team competitions, those established venue metrics remain central to the first numbers that appear on boards at major platforms.