Statistical Adjustments in Models for Cricket Wickets and Basketball Assists Across Betting Platforms
Morgan Beck · Jul 28, 2026
Statistical Adjustments in Models for Cricket Wickets and Basketball Assists Across Betting Platforms
Betting platforms adjust their statistical models for cricket wicket lines and basketball assist lines through ongoing data integration from player performances, team dynamics, and venue specifics. These models rely on historical datasets combined with real-time inputs to refine probability estimates that shape the odds offered to users. In July 2026 platforms continue to refine these calculations as cricket T20 leagues overlap with summer basketball competitions in various regions.
Core Components of Wicket Prediction Models in Cricket
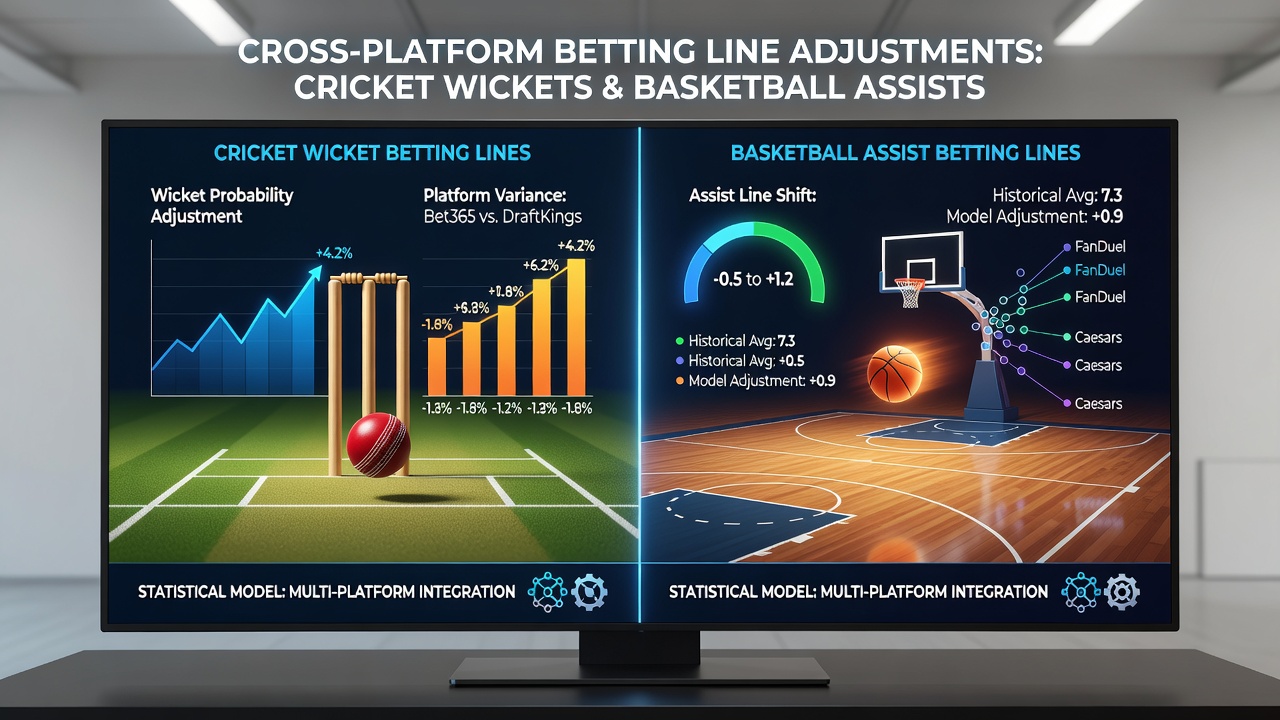
Researchers apply Poisson distributions and regression techniques to forecast wicket falls in cricket matches while factoring in bowler economy rates, batsman strike rates, and pitch deterioration over innings. Data from platforms shows that adjustments occur when new ball swing statistics or spin-friendly conditions alter expected outcomes. Observers note that models update parameters every few overs during live play because early breakthroughs shift the distribution of remaining wickets. Platforms incorporate weather variables such as humidity levels and temperature fluctuations that influence ball behavior on grass surfaces. Those who track these systems find that cross-platform variations arise when one operator weights recent form more heavily than another that emphasizes career averages against specific opposition.
Assist Line Modeling in Basketball Markets
Basketball assist betting lines draw from multivariate regression frameworks that link player passing efficiency to team pace, defensive schemes, and individual usage rates. Platforms recalibrate these equations after each game to reflect changes in rotation patterns or injury recoveries. Figures reveal that assist probabilities rise when teams increase their transition frequency yet fall under slower half-court sets. Adjustments also account for matchup data such as how a point guard performs against aggressive traps versus standard man-to-man coverage. Different sites apply distinct weighting to home-court advantages or back-to-back scheduling effects which creates slight divergences in the published lines.
Cross-Platform Calibration Techniques
Operators synchronize their models with shared industry feeds while maintaining proprietary tweaks that reflect their risk profiles. One platform might emphasize shot-location data from optical tracking systems whereas another prioritizes assist-to-turnover ratios derived from box-score archives. These differences surface most clearly when cricket wicket totals move between 4.5 and 5.5 or when basketball assist lines hover around 4.0 to 6.0 for key playmakers. In July 2026 ongoing tournaments prompt frequent recalibrations as squads rotate personnel during congested schedules. Platforms compare their outputs against aggregated market prices to identify and correct systematic biases before lines go live.

Incorporating External Variables and Real-Time Updates
Models integrate external factors including travel fatigue, altitude effects, and even crowd noise levels that can alter player decision-making. Cricket wicket forecasts receive updates when umpiring decisions or DRS reviews change the count of legitimate dismissals. Basketball assist calculations shift when foul trouble forces star players to the bench earlier than projected. According to industry reports from the Interactive Gambling Act oversight materials these layered inputs help maintain line integrity across operators. Platforms employ machine-learning overlays that detect anomalies in betting volume and trigger further parameter tweaks within minutes.
Comparative Analysis of Model Outputs
Side-by-side comparisons of lines from multiple platforms illustrate how small input variations produce measurable differences in implied probabilities. For instance one site might list a cricket all-rounder at 12 percent chance of claiming three wickets while another posts 14 percent after incorporating recent net-bowling data. Basketball assist lines show similar spreads when one model gives extra weight to secondary playmakers who record hockey-assist passes. Those monitoring these markets observe that arbitrage opportunities narrow as platforms align their statistical baselines through shared data consortiums. Yet residual gaps persist because each operator maintains distinct liquidity thresholds and liability caps.
Conclusion
Statistical model adjustments for cricket wicket and basketball assist lines continue to evolve through layered data inputs and platform-specific refinements. Observers see consistent patterns where real-time performance metrics drive updates that keep betting lines aligned with current conditions across July 2026 competitions. These processes rely on established statistical methods balanced against operational risk controls that differ from one platform to the next. Research summaries from national gambling studies confirm the role of ongoing calibration in maintaining market stability without introducing bias into published odds.